PRICE & TICK CALCULATION
Target labels show price, tick, and dollar calculations beside the corresponding order levels.
 FACTORTRADING
X FACTOR CUSTOM INDICATORS
A structured chart view of calculated order levels, projected targets, break-even adjustments, and projected loss context.
VIEW LABELED CHART →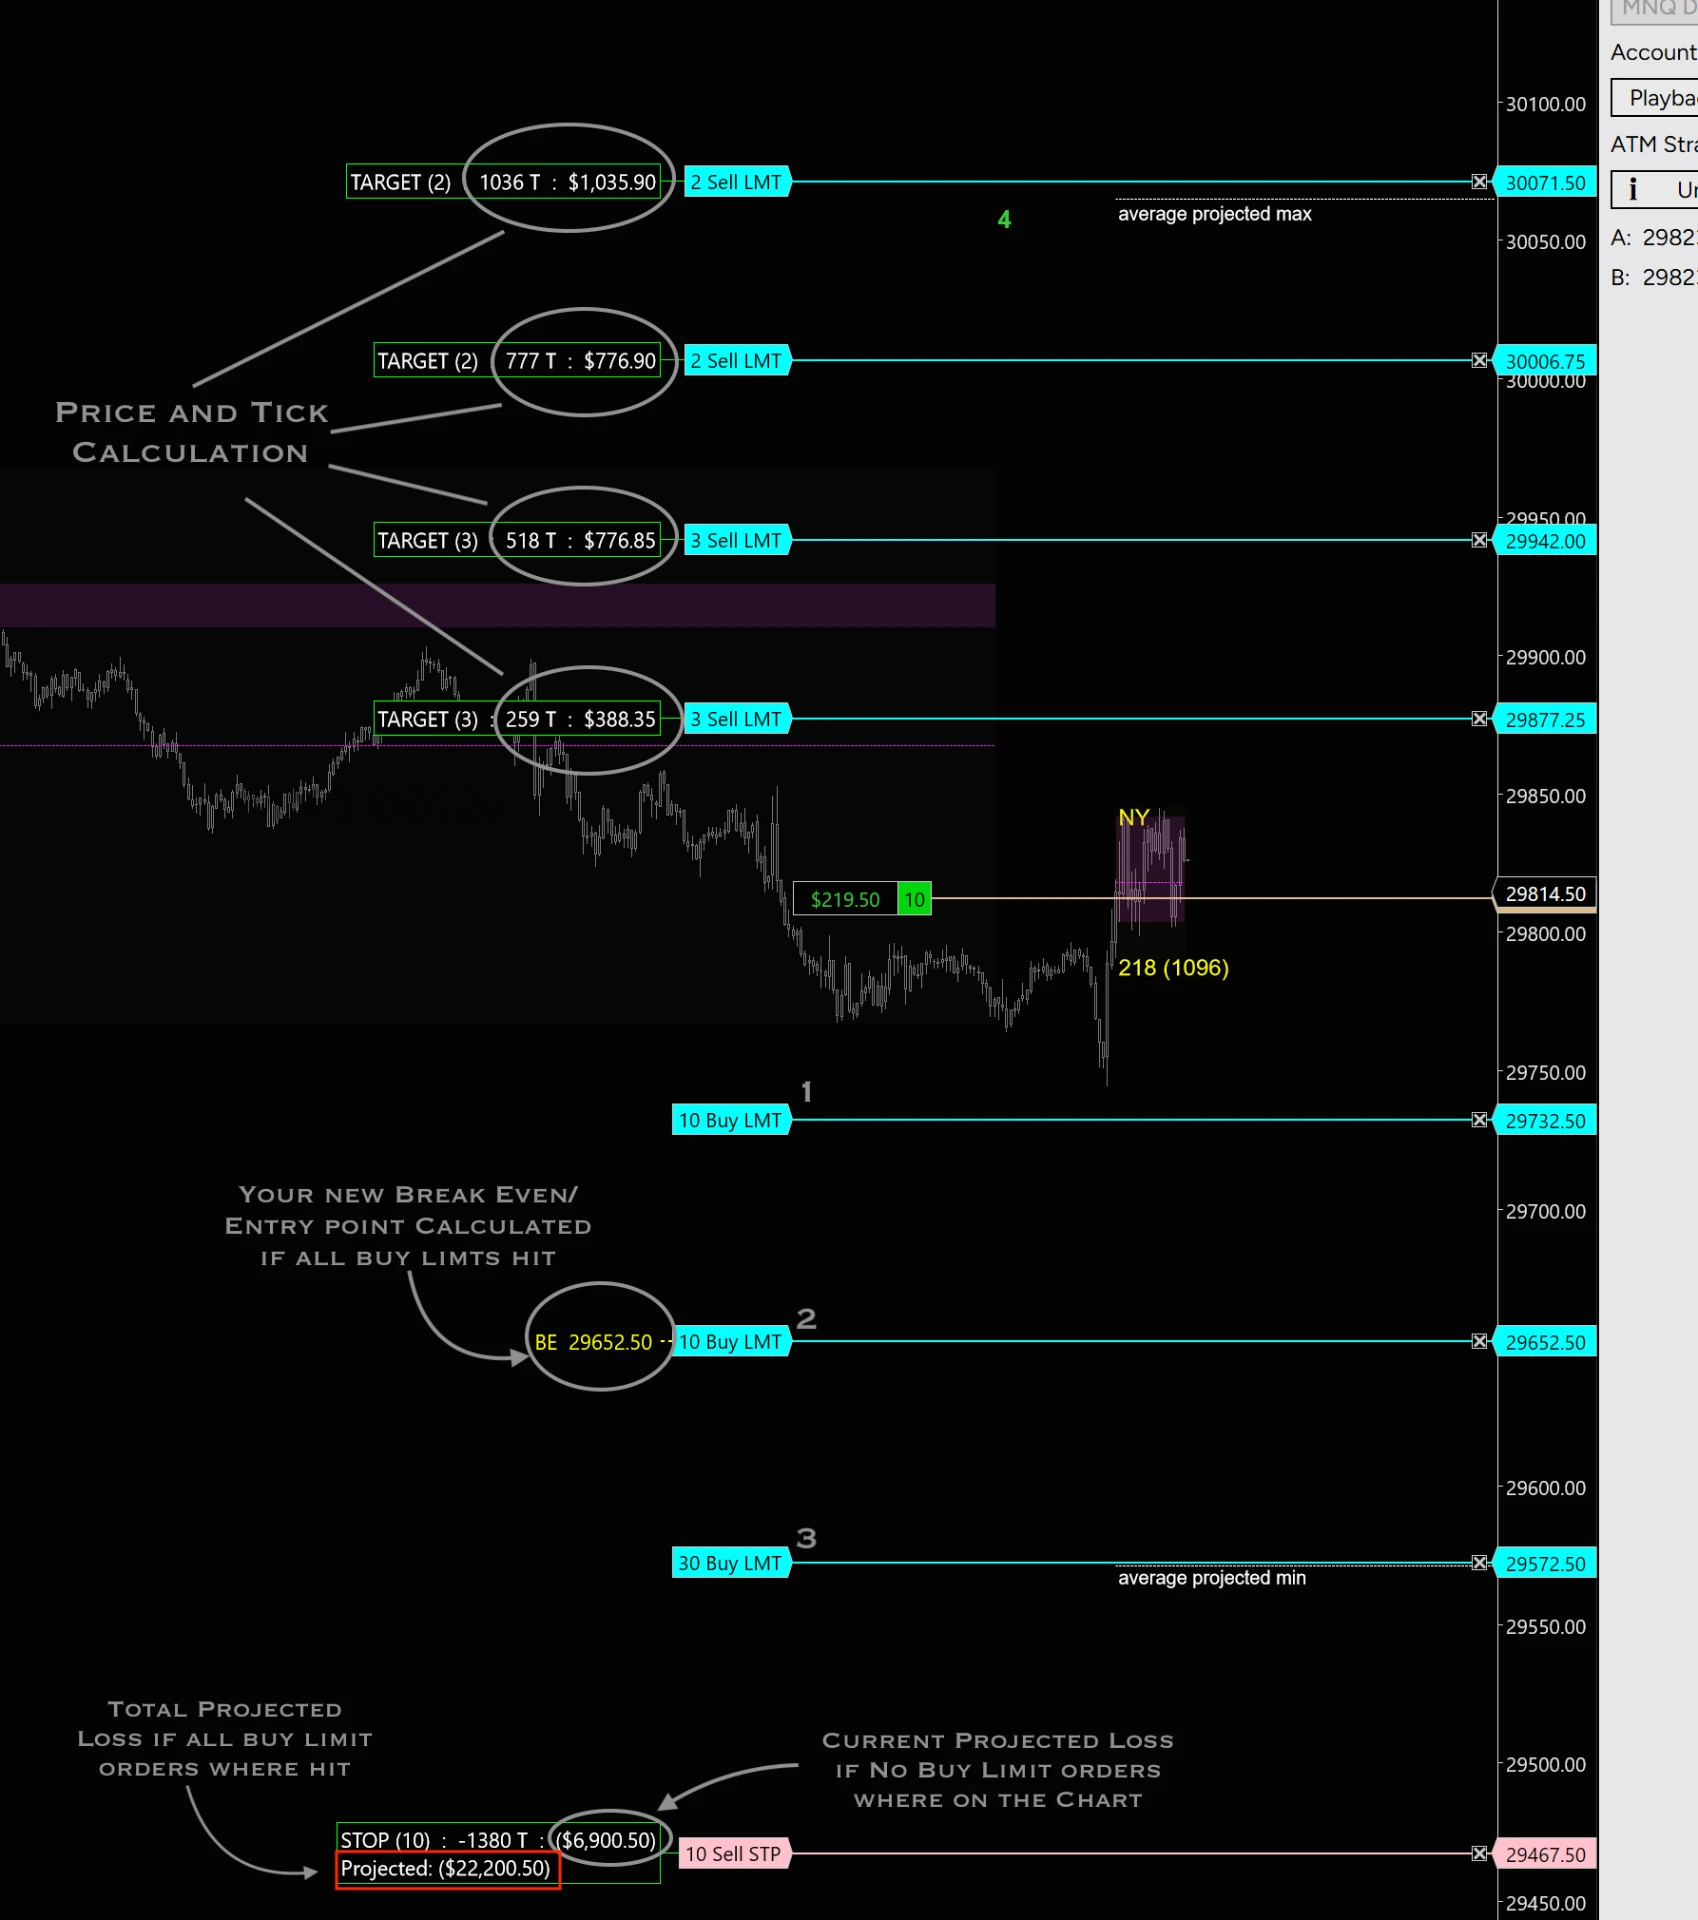
Select the chart to inspect every label at full size.
VISIBLE CHART STRUCTURE
LABELED DIRECTLY
ON THE CHART.
Target labels show price, tick, and dollar calculations beside the corresponding order levels.
Multiple sell-limit targets are plotted above price alongside average projected maximum context.
The example identifies a recalculated break-even entry when all displayed buy limits are hit.
The lower chart annotation distinguishes projected total loss from the current projected loss.
LEARN MORE
Contact X Factor Trading to ask about Ghost X, platform compatibility, and current access options.
Ask About Ghost X →